
menu
cancel
Half-life is one of the most quoted numbers in peptide conversations. It is also one of the most misunderstood.
A half-life may describe how quickly a measured peptide concentration falls during a defined phase. It does not automatically tell you how long the molecule remains active, how long a biological response lasts, or how often any product should be used.
Those questions require more than one number. Clearance, distribution, absorption, metabolism, receptor binding, downstream signaling, active metabolites, the assay, and the population being studied can all change the interpretation.
The useful question is not simply "What is the half-life?" It is "Which half-life was measured, under what conditions, and what does that measurement actually represent?"
In pharmacokinetics, half-life is the time required for a measured concentration to decrease by 50 percent during a specified phase of the concentration-time curve. When people report a terminal half-life, they mean the final measurable decline after the faster distribution processes have largely settled.
Half-life is a rate-of-decline concept. It is not a timer that announces when every molecule has disappeared, and it is not a direct measurement of biological effect.
That distinction matters because the concentration in plasma and the response in a tissue can follow different timelines.
A pharmacokinetic study measures the concentration of a defined analyte in a defined biological sample at selected time points. The analyte might be the intact parent peptide, a total drug-related signal, an active metabolite, or another measurable form. Plasma and serum are common matrices, but they do not reveal every concentration in every tissue.
Investigators plot concentration against time and estimate how the curve changes. If the terminal portion follows first-order behavior, equal time intervals produce equal proportional decreases. That is why a half-life repeats as halving rather than subtracting the same absolute amount each time.
The wording around the estimate matters. A plasma half-life describes a plasma measurement. A terminal half-life describes one phase of a curve. An apparent half-life after administration outside the bloodstream may reflect absorption as well as elimination. None of these terms is a synonym for total time in the body.
A simplified example makes the mathematics clear. Imagine a measured concentration that begins at 100 arbitrary units and follows a single first-order decline. Each half-life reduces the remaining concentration by half.
After one half-life, the measured concentration has fallen by half. After two, it has fallen to one quarter of the starting value. After five, the model leaves 3.125 percent. The value becomes smaller with each interval, but it does not become exactly zero in the mathematical model.
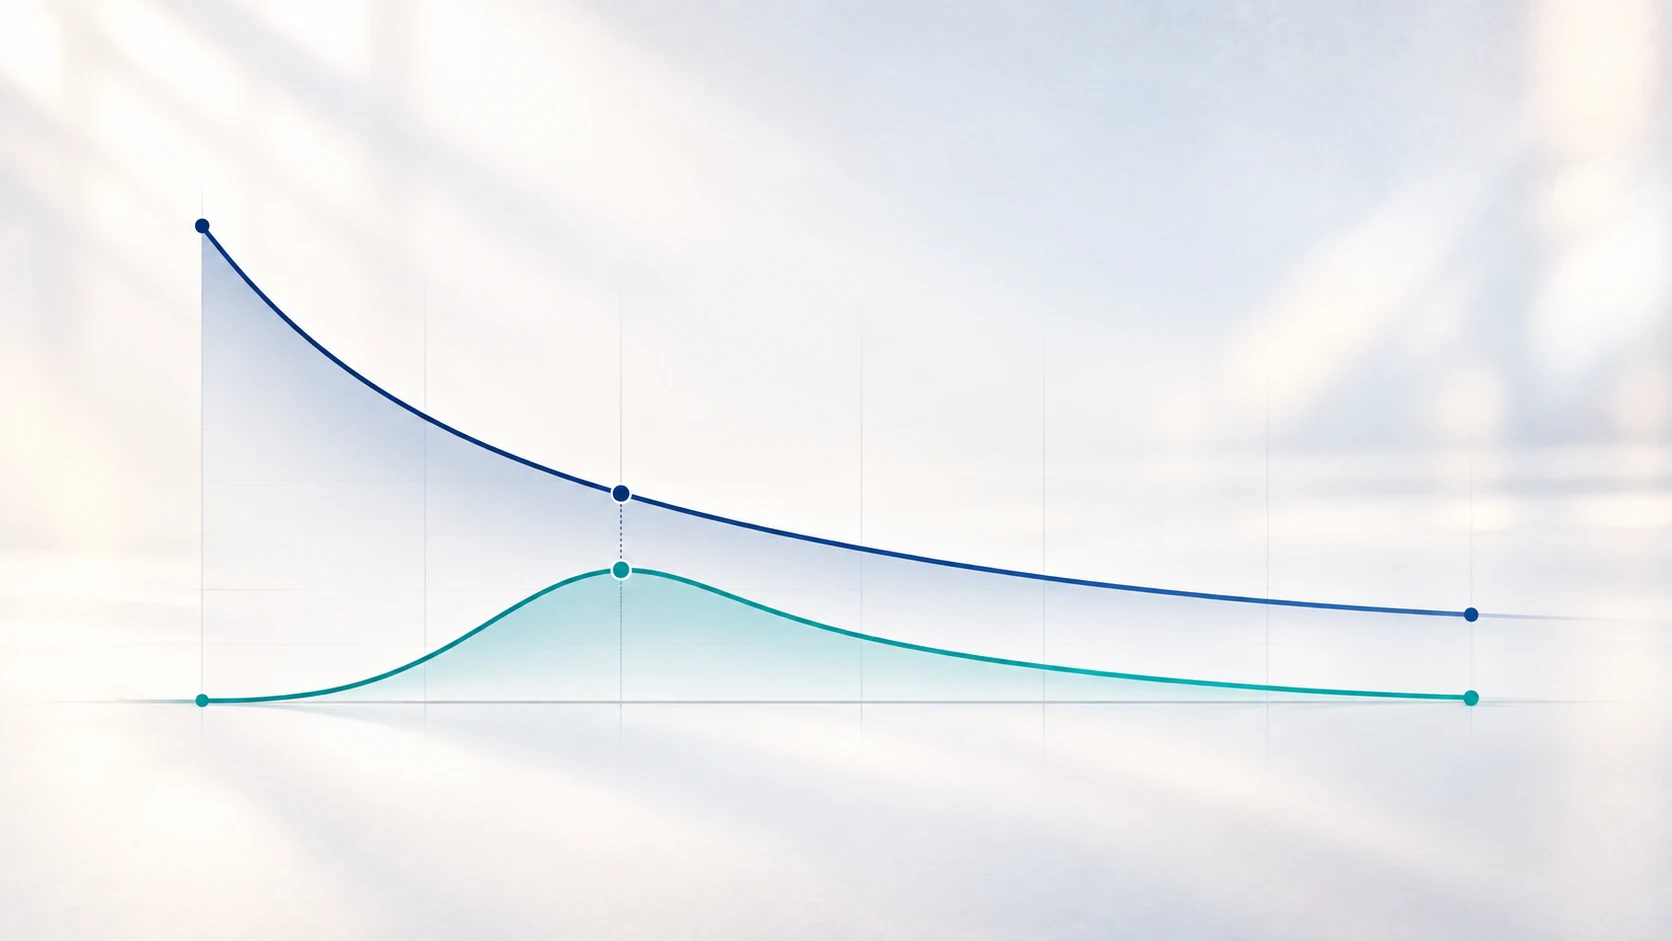
Real peptide profiles can be more complicated. Concentrations may rise during absorption, fall rapidly during distribution, then decline more slowly during a terminal phase. Assays also have lower limits of quantification, so the end of measurable data is not the same as proof that no molecule remains.
Half-life is a composite pharmacokinetic parameter. In a simplified one-compartment, first-order model, it increases when the apparent volume of distribution increases and decreases when clearance increases. The familiar relationship is approximately 0.693 times volume divided by clearance.
This is why a long half-life does not automatically mean that the body is poor at eliminating a molecule. A compound can also have a long terminal phase because it distributes extensively and returns slowly to the circulation where elimination occurs.
Clearance describes the body's ability to remove a substance from the measured fluid over time. It has units of volume per time, not percent per hour. Total clearance can combine several processes, including enzymatic degradation, renal handling, hepatic uptake, and target-mediated internalization.
Clearance and half-life answer different questions. Clearance addresses elimination capacity. Half-life describes the observed rate of decline after distribution and other conditions are taken into account.
Volume of distribution is not an anatomical container. It is a calculated value that relates the amount in the body to the measured concentration in plasma or blood. A larger apparent volume generally means that less of the measured material remains in the sampled central compartment relative to the total amount present.
Protein binding, tissue binding, molecular size, charge, hydrophobicity, and target interactions can all influence distribution. For a peptide, chemical modifications intended to change stability or binding may also change where the molecule appears and how the terminal curve behaves.
Many concentration-time curves have more than one visible phase. Soon after a molecule reaches the circulation, the concentration may fall quickly as it distributes from blood into tissues. A later, slower decline can appear after the movement between compartments approaches a working balance.
The first phase is often called a distribution phase. The last measurable phase is called the terminal phase. Reporting one terminal half-life can hide the faster events that came before it.
Route and formulation can complicate the picture further. If absorption into the circulation is slower than elimination from it, the terminal slope may be controlled by the input process. This is known as flip-flop pharmacokinetics. In that case, an apparent terminal half-life partly reflects how slowly the molecule enters the sampled compartment, not only how quickly the body clears it.
A half-life claim therefore needs the route of administration, formulation, sampling window, analytical method, and model. The number becomes less informative when those details disappear.
Peptides do not share one universal elimination pathway. Sequence, size, structure, charge, binding, chemical modification, and route can change their fate. Several mechanisms may operate at the same time.
Proteases and peptidases can cleave peptide bonds, creating shorter fragments and amino acids. Breakdown may occur in plasma, on cell surfaces, inside cells, and in organs involved in metabolism. Some cleavage products lose activity, while others may retain or gain biological activity. The assay must distinguish among them if that difference matters.
Smaller peptides may pass through glomerular filtration more readily than large proteins. After filtration, tubular uptake and intracellular catabolism can contribute to elimination. Renal contribution varies with molecular size, charge, protein binding, and peptide design. This is one reason kidney function may change exposure for some peptide and protein products.
The liver and other tissues can take up peptides through nonspecific processes or specific transport and receptor pathways. Internalized material may be degraded in endosomal and lysosomal systems. If high-affinity binding to a receptor leads to internalization and degradation, the target itself can become part of clearance.
Target-mediated drug disposition can produce nonlinear behavior when target binding is substantial relative to the amount present. Apparent clearance may then change across concentration ranges because a receptor-mediated pathway can saturate. One half-life measured under one condition may not transfer cleanly to another.
Pharmacokinetics asks what the body does to a molecule, including absorption, distribution, metabolism, and excretion. Pharmacodynamics asks what the molecule does to the biological system. The two are connected, but their time courses do not have to match.
A peptide may bind a receptor and start a signaling cascade. The plasma concentration can then fall while receptor occupancy, second messengers, enzyme activity, gene transcription, protein turnover, or feedback processes continue. The reverse can also happen: measurable peptide may remain in plasma after a system has become less responsive.
Delay between concentration and response is a recognized pharmacokinetic and pharmacodynamic phenomenon. Scientists may observe different effects at the same plasma concentration depending on when the measurement occurs. Distribution to the effect site, slow receptor kinetics, downstream cascades, active metabolites, tolerance, and feedback can all contribute.
This is why a plasma half-life cannot establish the end of a biological response. Researchers need effect measurements and an exposure-response model, not a concentration curve alone.
Two molecules can share a reported half-life and still produce very different concentration profiles or biological responses.
One may reach a high peak and decline quickly into a long, low terminal tail. Another may enter circulation gradually and maintain a flatter profile. They can also differ in total exposure, bioavailability, tissue distribution, receptor affinity, receptor residence time, intrinsic activity, active metabolites, and the concentration needed to produce an effect.
Half-life says nothing by itself about potency. A small concentration can be meaningful for one target and irrelevant for another. It also does not establish safety. Longer exposure can support a desired response in one development program and prolong unwanted effects in another.
Scientists therefore interpret half-life alongside the full concentration-time curve, maximum concentration, total exposure, target engagement, pharmacodynamic markers, safety data, and the variability observed across study participants.
A published half-life is an estimate from a particular study. It is not a permanent constant that belongs to a sequence under every condition.
The estimate may change with:
1. The exact molecular form, including conjugates, salts, modifications, and active metabolites
2. The route of administration and the rate at which the molecule enters circulation
3. The species, study population, age range, body size, and organ function represented
4. The concentration range when clearance or target binding is nonlinear
5. The biological matrix and whether the assay measures intact, free, bound, total, or drug-related material
6. The timing and duration of sample collection, especially near the terminal phase
7. The analytical sensitivity and the model used to estimate the terminal slope
FDA guidance on population pharmacokinetics notes that concentrations can vary among people receiving the same regimen and that factors such as body weight, renal or hepatic impairment, genetics, food, and interacting medicines may contribute. Whether any difference is clinically meaningful requires exposure-response and safety evidence. [3]
A half-life quoted without its study context may be numerically correct and still be used to support a conclusion the study never tested.
Many unmodified peptides are cleared or degraded too quickly for a practical therapeutic profile. Drug developers may redesign a peptide or its delivery system to slow proteolysis, reduce renal filtration, increase binding to long-lived carrier proteins, or control the rate of release. [4][6]
Common strategies include replacing selected residues, blocking vulnerable ends, cyclizing the chain, adding fatty-acid groups that promote albumin binding, attaching polymers, increasing effective molecular size, using carrier-protein fusions, or placing the peptide in a controlled-release formulation. [6]
A modification can create tradeoffs. A change that slows clearance may also alter receptor binding, tissue access, solubility, aggregation, immunogenicity, manufacturing, analytical testing, or the identity of circulating metabolites. Longer is therefore a design choice, not a universal measure of quality.
The right duration depends on the target, the desired exposure pattern, the biological response, safety margins, patient needs, and evidence from development studies. It cannot be selected from half-life alone.
A half-life usually describes a measured concentration during a defined phase. It does not directly state how much of the original administered amount remains, and it does not prove that the remaining measured material is producing an effect. [1]
In the idealized first-order model, 3.125 percent of the starting concentration remains after five half-lives. In a real study, the signal may fall below the assay's quantification limit before or after that point. Neither condition is identical to absolute absence from every tissue.
A longer half-life can reduce concentration swings or support a development goal, but it can also extend unwanted exposure and delay reversibility. The value has meaning only in relation to target biology, exposure-response, safety, and the intended clinical use.
Plasma concentration and biological effect can separate in time. Delayed tissue distribution, receptor kinetics, signaling cascades, active metabolites, feedback, and tolerance can make the response shorter or longer than the measured plasma profile.
Different studies may use different molecular forms, populations, routes, assays, sampling schedules, and models. A discrepancy is not automatically an error. It is a reason to compare methods before comparing numbers.
Before repeating a half-life number, ask for the study behind it. A credible report should make the measurement interpretable.
1. Which exact peptide or modified form was studied?
2. Was the estimate measured in humans, animals, cells, plasma, serum, or another system?
3. Which route and formulation were used?
4. What did the assay measure: intact parent, free material, total material, or metabolites?
5. Does the number describe distribution, terminal decline, absorption-limited decline, or an in vitro stability test?
6. How long were samples collected, and was the terminal phase adequately characterized?
7. Was the behavior linear across the concentrations studied?
8. Were variability and uncertainty reported?
9. Was biological effect measured separately from concentration?
A claim that cannot answer those questions may still contain a real number. It simply does not contain enough context to support a broad conclusion.
Used correctly, half-life helps scientists describe the terminal decline in concentration, compare formulations or molecular designs under matched conditions, plan sampling windows, model accumulation and time to steady state, and connect exposure to pharmacodynamic measurements.
It is one piece of a larger pharmacology story. The strongest interpretation combines the concentration-time curve with clearance, distribution, bioavailability, metabolites, target engagement, biological response, safety, and the limits of the study.
Half-life becomes misleading when it is treated as a shortcut for effectiveness, safety, product quality, or individualized use. Those are separate questions with separate evidence requirements.
Peptide half-life describes a proportional decline in a measured concentration during a defined phase. It does not mean that half the original amount remains active, and it does not tell you when every biological effect ends.
Clearance and distribution shape the number. Absorption, metabolism, receptor binding, assay design, sampling, and population can change what the estimate represents. Plasma concentration and biological response can also follow different timelines.
So when you see a half-life quoted as proof that a peptide is long-lasting, fast-acting, safe, or effective, slow down. Find the study. Identify the analyte, matrix, route, phase, and method. Then ask whether anyone measured the outcome being claimed.
That is how half-life becomes useful science instead of a persuasive number without context.
1. Toutain PL, Bousquet-Melou A. Plasma terminal half-life. J Vet Pharmacol Ther. 2004;27(6):427-439.
2. U.S. Food and Drug Administration. Clinical Pharmacology: Early Drug Development. 2023.
3. U.S. Food and Drug Administration. Population Pharmacokinetics: Guidance for Industry. 2022.
This article is for general educational and informational purposes only. It does not constitute medical, scientific, laboratory, regulatory, diagnostic, or treatment advice.
Pharmacokinetic values are specific to the molecule, formulation, route, study design, analytical method, population, and model used. A published half-life should not be used by itself to predict an individual's response or make treatment decisions.
Do not use this article to select, obtain, prepare, dose, combine, administer, or discontinue any product or treatment. Follow approved product labeling and consult qualified medical, scientific, and regulatory professionals for decisions about use, development, testing, or interpretation.